The State of Learning Data & xAPI
You’ve likely heard the phrase, “Business Runs on Data” but what does this mean for L&D? With the advent of xAPI, organizations can gain understanding of employee behavior and performance better than ever before. But what can we do with this data?
Learning data has long been siloed away from other business data providing a myopic view of how we think about and report on learning. We report on seat hours of training, distribution of scores, and course completions. Yes, these metrics can make us feel accomplished with our work but render little more insight into the impact of training than reporting on pounds of humans trained per year.
The Challenge – Objectives, Mastery & Safety Performance
 A natural gas production company recently asked the question: how do test scores correlate to safety performance? What they discovered changed the way they look at training across the organization and has driven a revamp of training processes that earned the eLearning Guild’s Best Business Process award at the DevLearn 2018 DemoFest. More impressive is the fact that all this work was done with existing tools and data sources avoiding costly integrations or long development times.
Both Learning and Safety were mature functions within the organization. With more than 5,500 employees working across six states in a high-consequence industry, training truly provides part of an organization’s license to operate. Safety training was largely delivered through SCORM-based online content with embedded tests to document mastery. But with a passing score of 70%, limited item analysis and no link between test questions and learning objectives, it was difficult to sort where knowledge gaps existed.
Safety data is also being tracked within the organization a couple different ways. Accidents, near misses, and other incidents were tracked historically and reported across the organization. Behavior-based safety observation programs were in place that allowed the trending of safety concerns but does an increase in “hearing protection” related observations indicate a lack of training? Moreover, safety data existed in safety systems, and learning data existed in learning systems and never the two did meet.
The Solution – Updated Process & Analytics
The catalyst for change was a simple challenge voiced by the executive leadership team. One member said,
“If we are taking time to test on objectives that are important to safely do a job, then it makes sense to utilize that data to follow up on missed objectives.”
The first problem discovered was that they had little data tying assessments to objectives. While the SCORM standard allows for objectives to be associated with test questions, they found that this data was not populated in any of their off-the-shelf content. Nor did the rapid development authoring tools used in-house provide a native function for tagging an objective to a test question. To fill this data void, xAPI was used to send question completion data to the Learning Records Store. Each xAPI statement included the Objective(s) measured by that question. The existing ADL object type for Objective was used within the context of each xAPI statement for consistent reporting.
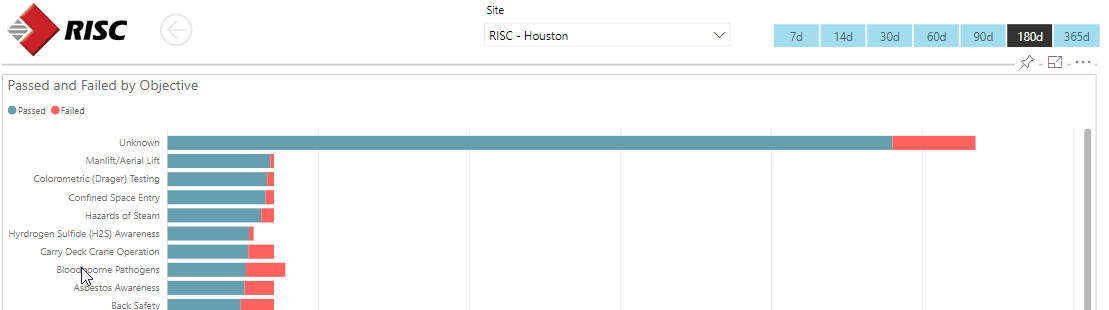
All questions from SCORM modules display “Unknown” objective.
This change shined a spotlight not only on objectives which were consistently not mastered (even though students passed the overall test) but also on objectives that were being under assessed. This realization kicked off an internal process between Subject Matter Experts and Instructional Designers to ensure assessments provided an accurate gauge of mastery at the objective level.
Safety data was stored in a SQL database and not as xAPI data. Because the purpose of the safety data was to show trends and not track back to individual learners, there was no need to convert the incident tracking and behavior-based safety observation data to xAPI. It would be left in its native format and incorporated into data visualizations using a business intelligence tool.
Because the company was already using Microsoft Power BI tool for creating visualizations and Microsoft Flow to move data between systems, we were able to use the same infrastructure (and development expertise) to pull data from four sources into a reporting database.
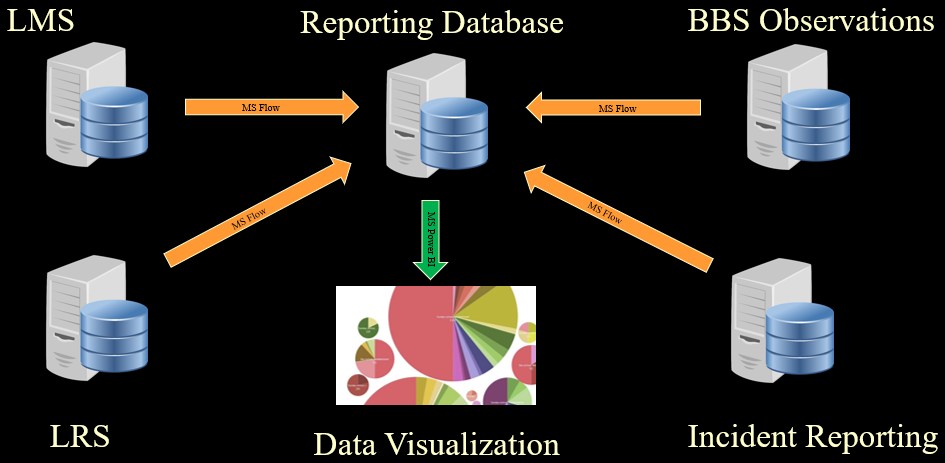
- LRS – xAPI data was pulled from the LRS to provide information on course, test and question completion, as well as mastery by objective.
- LMS – Employee and supervisor data was extracted from the LMS to allow data visualizations to be sub-divided by department, team, work area, and supervisor as needed.
- BBS Observations – Behavior Based Safety Observations, organized by observation category, was brought in from a stand-alone BBS Observation system.
- Incident Reporting – An incident reporting database provided information on safety incidents over time.
The result is a dashboard with drilldown capabilities that is emailed weekly to all supervisors. At the highest level, this dashboard shows:
- Checklist Met vs. Not Met
- Competency Assessments Satisfied vs. Not Satisfied
- Questions Passed vs. Failed by Objective
- Activities (courses) Passed vs. Failed
- Safety Incident Reporting
- Incident Trends
- Total Activity by Day
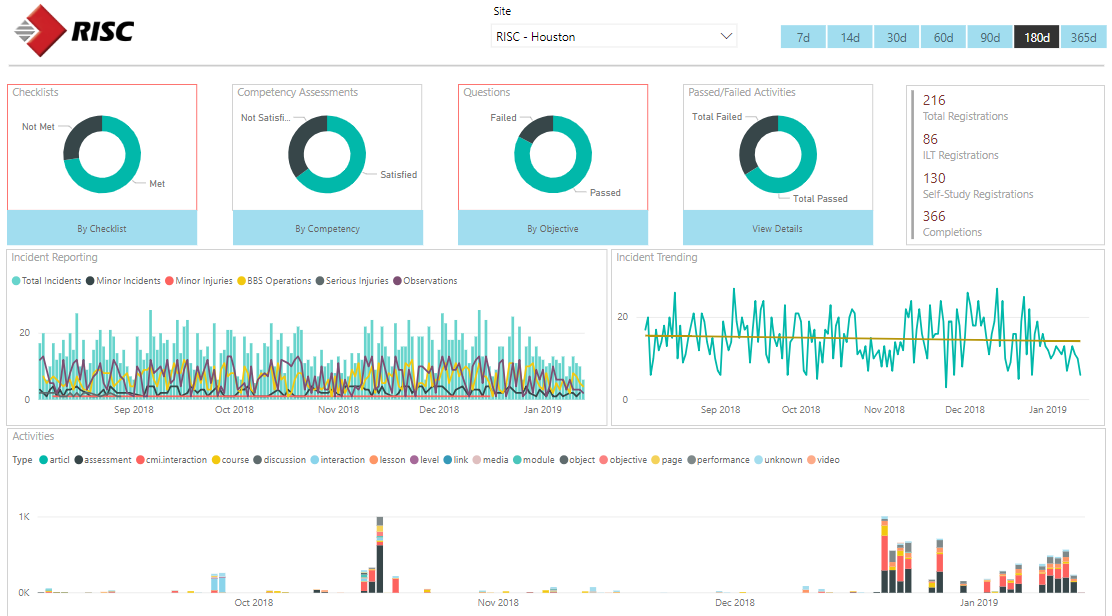
The dashboard can be filtered by employee site and date range to control how far in the past to display the data.
From this overview, the dashboard allows drill down into each of the components.
Moving Forward – Ongoing Evaluation and Communication
As a result of this insight, operational processes were updated to require mastery of each competency within a course. If a topic is not mastered, focused SME intervention is used on the failed objective. Gaps were also identified and closed between content and assessments. In some cases, content focused on information that was not an objective for the course. In other cases, assessments did not accurately gauge the mastery of an objective.
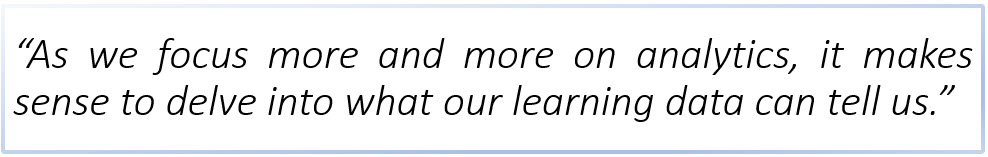
The weekly emailing of dashboards provides improved and consistent communication across the organization. With increased visibility, all employees share in the ownership of learning and safety goals. After implementation, one training coordinator said,
“As we focus more and more on analytics, it makes sense to delve into what our learning data can tell us.”
Interested in learning more? Join RISC at an upcoming learning event or contact Duncan Welder at duncanw@risc-inc.com or call 281-480-7910.
Mr. Welder’s career is founded in traditional instructional design and computer-based training development. He is a certified Development Dimensions International facilitator, a Kirkpatrick Certified Evaluator and facilitator of the Ohio State University curriculum development program. In addition to working in industry, Mr. Welder has held adjunct faculty positions at Bowling Green State University, Ohio and the College of the Mainland, Texas. Mr. Welder has been published in both Training Magazine as well as US Business Review.