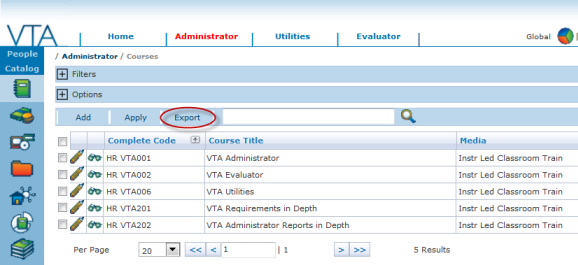
This is part 1 of a three part article on the new grids in v6.3.
In VTA Backoffice version 6.3, we have re-engineered the main data grids in the system. This was primarily done to improve performance. However, in addition to a significant improvement in performance, the new grids give you more control over what data is displayed on the grid, how many rows to show on the grid, better filtering capabilities and exporting grid data to CSV. We are very excited about the new grids and we think you will be too!
Filters
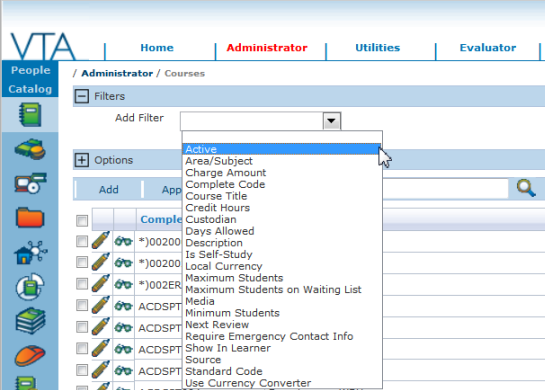
The new grids contain a Filters section where you can choose the fields you wish to use to filter the data that will be displayed on the grid. For data entities like Employee, Course, History and Schedule that contain many fields on the General tab, you will notice that you have an extensive list of fields to choose from on the grid.
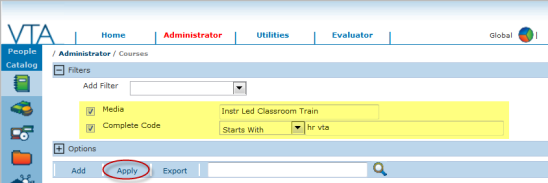
As you choose a filter, you must define the criteria for that filter. You can use multiple filters at the same time and only data that meets all the filter criteria you have defined will be displayed on the grid when you click the Apply button. The Apply button also saves your filter settings, so the next time you return to the grid, the last filter settings you used will be “remembered.”
Options
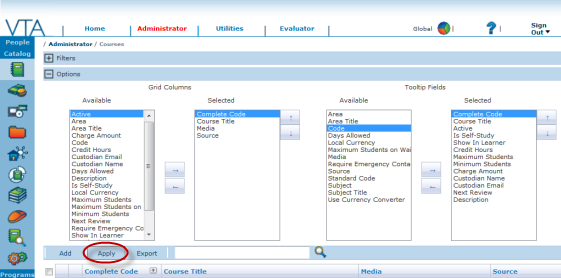
The new grids contain an Options section where you can choose the fields and the order in which those fields will display on the grid. You can also choose the fields you wish to display in the tool tip that is visible when you hover over the browse icon beside each record displayed on the grid.
There is no limit to the number of fields you can choose from the available field list to display on your grid or in the tool tip. The screen now grows and scrolls horizontally to accommodate all fields selected for display on the grid.
Your selections will take affect when you click the Apply button. As with the Filter settings, the Apply button also saves the selections made in the Options section, so the next time you return to the grid, the fields selected for display on the grid and in the tool tip are “remembered.”
Sorting/Searching
All selected grid columns are sortable and searchable. To sort by a column, simply click on the column heading. The sorted column will have an arrow next to the column name that indicates the sort order. To change the sort order, just click the column heading again.
Page Controls
We also added a few new features in the page controls area at that bottom of the grids.
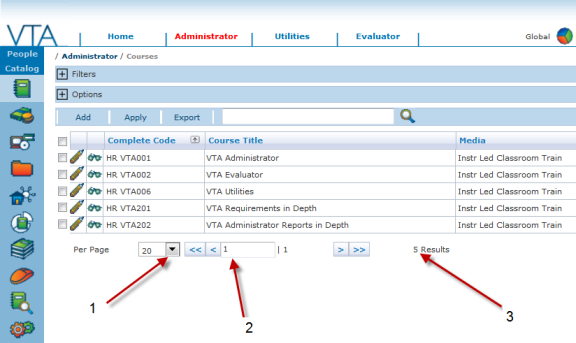
• In previous versions of VTA Backoffice, the number of records to display per page was fixed. Now, you can choose the number of records you want to display per page. (1)
• In addition to the paging controls first, next, prev and last that existed in previous versions of VTA Backoffice, we have added the ability to page to a specific page number on the grid by typing in the page number and pressing the enter or tab key. (2)
• Along with the number of total pages, now the number of results is also displayed at the bottom of each grid. The number of results indicates the number of records that meet the filter criteria you have defined. (3)
Exporting
And last, but not least, we have add the ability for you to export the data displayed on the grid to CSV. By using Filters to select the desired records and Options to select the desired fields, you can do some simple reporting directly from the grid.
Just to get you started… Here are just two ideas for the kinds of reports you can generate using the Export feature on the new grids. Since no standard reports exist for these types of reports, prior to version 6.3, there was no way to generate these reports. Now you can.. by simply accessing the appropriate grid, setting filters to return only the records you want to include, setting the options to show only the fields you want to include, then clicking Apply followed by Export.
1) List reports for departments, workareas, job titles, positions, teams etc.
2) Course catalog reports across sites in a multi-site system.
For more on the new grids, see Part 2 of this article.

