In-Progress Aging Dashboard Widget
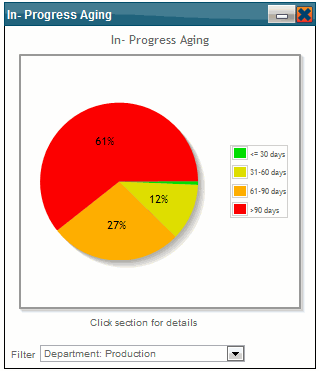
The In-Progress Aging widget shows a pie chart indicating the aging of your students’ in-progres training. Pie sections are shown for:
- Training that has been in-progress for 30 days or less
- Training that has been in-progress for 31-60 days
- Training that has been in-progress for 61-90 days
- Training that has been in-progress for more than 90 days

You can click any section to view a detail grid showing the in-progress training.
Filter
You can use the drop-down Filter list to display the pie chart for your supervised groups (departments, work areas and teams). Or you can select “All” to show in-progress training for all the employees you supervise.
Training Hours For Year Dashboard Widget
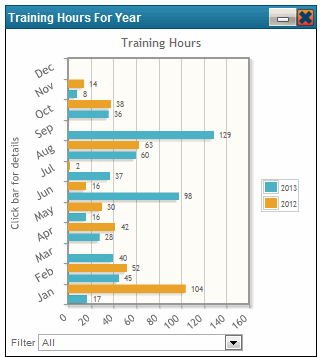
The Training Hours For Year widget shows the total number of training hours completed by your students each month. Both the current year and the previous year are shown.

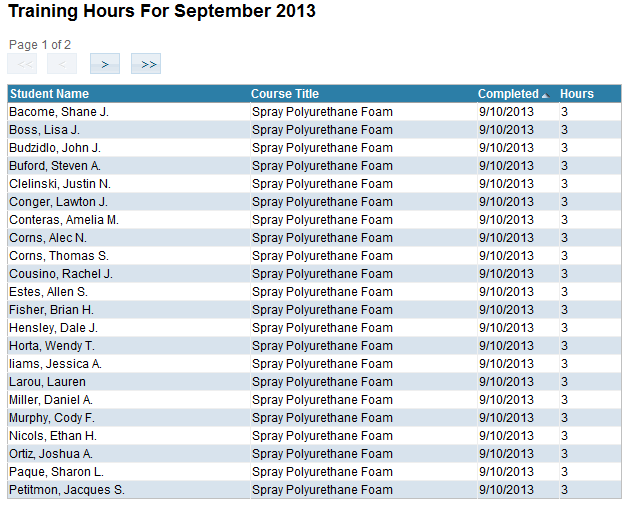
You can click on any bar to display a detail grid of completed training hours for that month/year.

